May 30, 2008

Optimizing SQL Server Performance

Optimizing SQL Server CPU Performance
A number of factors can affect CPU utilization on a database server: compilation and recompilation of SQL statements, missing indexes, multithreaded operations, disk bottlenecks, memory bottlenecks, routine maintenance, and extract, transform, and load (ETL) activity, among others. CPU utilization is not a bad thing in itself—performing work is what the CPU is there for. The key to healthy CPU utilization is making sure that the CPU is spending its time processing what you want it to process and not wasting cycles on poorly optimized code or sluggish hardware.

There are two paths to identifying CPU performance problems. The first is reviewing the system's hardware performance, and second is SQL Server performance issues.
For CPU performance problems, use PerfMon SQL Profiler.
Look for performance counters like
i ) % Processor Time <90%
ii) Processor Queue Length : Processor Queue Length shows how many threads are waiting to perform work on the CPU. Typically you shouldn't have anything higher than five times the number of physical processors on a dedicated SQL Server.
iii) Context Switches/sec: It should be less than 5000 times the number of processors in the server. When CPU utilization and context switches both exceed their thresholds regularly, this indicates a CPU bottleneck. If this is a regular occurrence, you should start planning for the purchase of more or faster CPUs if your system is outdated.
If you are seeing Context Switches/sec higher than 5000 per physical processor you should strongly consider turning off hyper-threading on your system and retesting performance.

Some considerations for T-SQL CPU optimization are:
Query plan reuse
Reducing compiles and recompiles
Sort operations
Improper joins
Missing indexes
Table/index scans
Function usage in SELECT and WHERE clauses

Optimizing SQL Server Memory Performance

The Memory\Pages/sec counter indicates the number of paging operations to disk during the measuring interval, and this is the primary counter to watch for indication of possible insufficient RAM to meet your server's needs. A good idea here is to configure a perfmon alert that triggers when the number of pages per second exceeds 50 per paging disk on your system.

Another key counter to watch here is Memory\Available Bytes, and if this counter is greater than 10% of the actual RAM in your machine then you probably have more than enough RAM and don't need to worry.

Optimizing SQL Server I/O Bottlenecks

If “Average Disk Sec/Read” is between 200ms and 300ms delays, then there is I/O bottleneck. Possible solution is Defragmenatation.
Another solution is increase I/O bandwidth -such as adding more disks.
Storage area networks, or SANs, are widely used to store data for Microsoft SQL Server installations with large databases. SANs are one of the most economical ways to deal with very large data sets. They're designed to scale better in this regard than disk arrays installed directly on the host.
Data files should be placed on one or more RAID 5 or RAID 6 arrays (based on system needs). In certain systems, you should place the data files on RAID 1 or RAID 10 arrays, but those systems are in the minority. Place the transaction log files on one or more RAID 1 or RAID 10 arrays (again, based on size and performance needs). The tempdb database should be placed on its own RAID 1 or RAID 10 array.

Optimizing tempdb Performance
The size and physical placement of the tempdb database can affect the performance of a system. For example, if the size that is defined for tempdb is too small, part of the system-processing load may be taken up with autogrowing tempdb to the size required to support the workload every time you restart the instance of SQL Server. You can avoid this overhead by increasing the sizes of the tempdb data and log file.

Perfmon counters to watch:

How to change SQL 2005 listening Port

If enabled, the default instance of the Microsoft SQL Server Database Engine listens on TCP port 1433. Named instances of the SQL Server Database Engine and SQL Server Mobile are configured for dynamic ports, which means they select an available port when the SQL Server service is started.
To assign a TCP/IP port number to the SQL Server Database Engine In SQL Server Configuration Manager, in the console pane, expand SQL Server 2005 Network Configuration, expand Protocols for , and then double-click TCP/IP. In the IPn Properties area box, in the TCP Port box, type the port number you wish this IP address to listen on, and then click OK.
In the console pane, click SQL Server 2005 Services. In the details pane, right-click SQL Server () and then click restart, to stop and restart SQL Server. After you have configured SQL Server to listen on a specific port there are three ways to connect to a specific port with a client application:
1. Run the SQL Server Browser service on the server to connect to the Database Engine instance by name.
2. Create an alias on the client, specifying the port number.
3. Program the client to connect using a custom connection string.

TSQL SQL Server 2005 Debugging

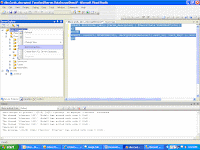
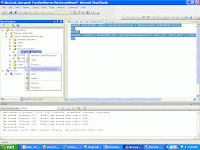
With Microsoft SQL Server 2000 it was possible to debug stored procedures from directly within Query With SQL Server 2005, however, this functionality was moved out of SQL Server Management Studio and into the Visual Studio IDE. Using this technique, it is possible to step into your stored procedures, one statement at a time, from within Visual Studio. It is also possible to set breakpoints within your stored procedures' statements and have these breakpoints hit when debugging your application. 1. Open Visual studio 2. Click “view” and then “server explorer” 3. Right click “Data connections” and add connection 4. Expand Stored Procedure 5. Select Procedure which need to debud 6.Right click and choose option “Step Into Stored Procedure”


May 23, 2008

PERFORMANCE TUNING Oracle 10g

What SQL is currently using the most resources?
This query will get you started in the proper direction of zeroing in on what SQL statement is consuming the most resource wait times on your system. No longer do you have to go to the V$SQLAREA and try to pick out the top 10 or 20 SQL hogs on your system by disk reads or executions. Now you really know what SQL statements are consuming resources and waiting the most. These are the SQL that you really need to tune because the fact that a SQL statement performs 20,000 reads does not mean that it is a bottleneck in your system.

select active_session_history.user_id,
dba_users.username, sqlarea.sql_text,
sum(active_session_history.wait_time + active_session_history.time_waited) ttl_wait_time from v$active_session_history active_session_history,
v$sqlarea sqlarea, dba_users
where active_session_history.sample_time between sysdate - 60/2880 and sysdate
and active_session_history.sql_id = sqlarea.sql_id
and active_session_history.user_id = dba_users.user_id
group by active_session_history.user_id,sqlarea.sql_text, dba_users.username
order by 4

What object is currently causing the highest resource waits?

This is a great query. Now we can actually see which objects a SQL statement is hitting. Moreover, if you take a further look at the V$ACTIVE_SESSION_HISTORY view you will see that you can tailor this query to report on the actual blocks that are being accessed within the objects for the SQL statement. This is great help in determining if you may need to reorg your object or redistribute to reduce the contention on that object.

select dba_objects.object_name,
dba_objects.object_type,
active_session_history.event,
sum(active_session_history.wait_time + active_session_history.time_waited) ttl_wait_time from v$active_session_history active_session_history,
dba_objects
where active_session_history.sample_time between sysdate - 60/2880 and sysdate
and active_session_history.current_obj# = dba_objects.object_id
group by dba_objects.object_name, dba_objects.object_type, active_session_history.event
order by 4

Oracle 10g Job scripts

Oracle 10g Job scripts:

1. To enable or fix broken jobs in Oracle 10g

BEGIN
DBMS_SCHEDULER.ENABLE ('ORACLE_JOB');
END;
/
2. Modifying or setting Oracle 10g Jobs
begin
dbms_scheduler.set_attribute (
name => 'ORACLE_JOB',
attribute => 'REPEAT_INTERVAL',
value => 'FREQ=WEEKLY;BYDAY=MON;BYHOUR=22;BYMINUTE=0'
);
end;
commit;
3. See Oracle job details
i) Job information:
select *from dba_scheduler_jobs
WHERE job_name in ('ORACLE_JOB');
ii) Job run details:
select log_date,to_char(log_date,'DAY'),
additional_info
from dba_scheduler_job_run_details
WHERE job_name ='ORACLE_JOB'
order by log_date desc;
iii) Running job details:
select *
from dba_scheduler_running_jobs
WHERE job_name in ('ORACLE_JOB');
iv) Job logs:
select * from dba_scheduler_job_log
WHERE job_name in ('ORACLE_JOB')
order by log_date desc;
v) Job session details:
select jr.job, s.username, s.sid, s.lockwait, s.logon_time
from dba_jobs_running jr, v$session s
where jr.sid = s.sidorder by jr.job;

Creating DataFrames from CSV in Apache Spark

 from pyspark.sql import SparkSession spark = SparkSession.builder.appName("CSV Example").getOrCreate() sc = spark.sparkContext Sp...